Reporting growth and demand generation is something few organizations are doing successfully. Without a process in place to measure and assess your campaigns, acquisition, and revenue, it’s hard to decide your future marketing investments and know how your marketing efforts are performing. It’s important to prioritize setting targets and objectives, but many other practices and metrics are often ignored. In this blog, you’ll learn about 3 key pillars you can implement to get the most out of your data - resulting in a more organized, streamlined process to successfully and accurately measure results.
Having all of your marketing metrics in one Command Center provides you with an ability to monitor and continuously adjust course. The Command Center should be easily available for all your stakeholders outside of marketing, including Sales Leadership, Revenue Performance, Product Marketing and the rest of the C-Suite.
You can leverage reporting platforms like Tableau, Microsoft PowerBI, or DOMO which pull data from different company sources, or you can work directly within your marketing automation platform using Marketo Revenue Explorer, Oracle BI EE, or HubSpot Analytics. It makes sense to report where most of your company leadership can easily access and make decisions based on this information.
The effectiveness of initiatives like Account Based Marketing (ABM), Marketing Qualified Leads (MQLs) trends and Partner Marketing activities can all be monitored in one place. We suggest categorizing your marketing activities and campaigns in your marketing automation platform, this way the Command Center can report trends, sources, and categories. Whether you’re dividing by marketing type (physical or digital), acquisition activity, channel (paid or unpaid) or new/existing business, categories help keep you organized. Below are few insights which must be easily accessible in your Command Center:
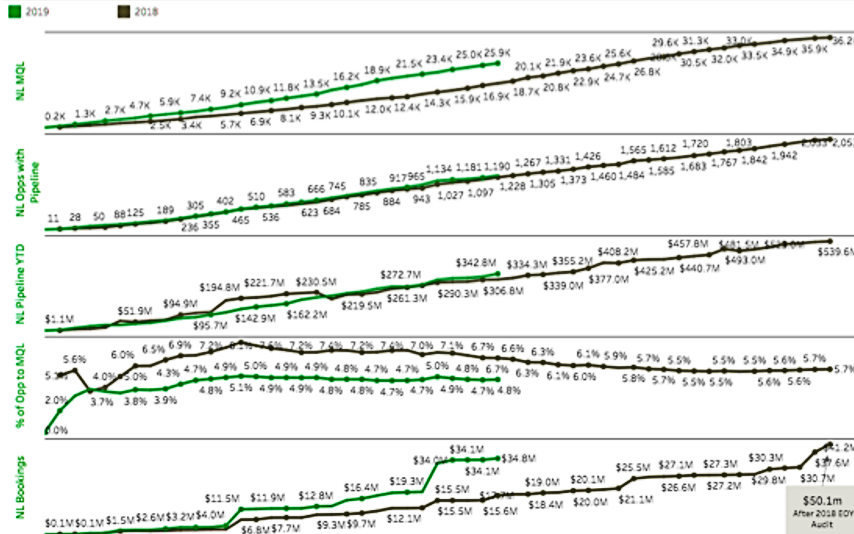
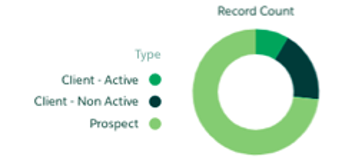
Marketing Sourced New Logos, MQLs, Pipeline and Bookings
What is year-over-year growth? Year-over-year (YOY) is the comparison of one period with the same period from the previous year. The period is typically a month or quarter.
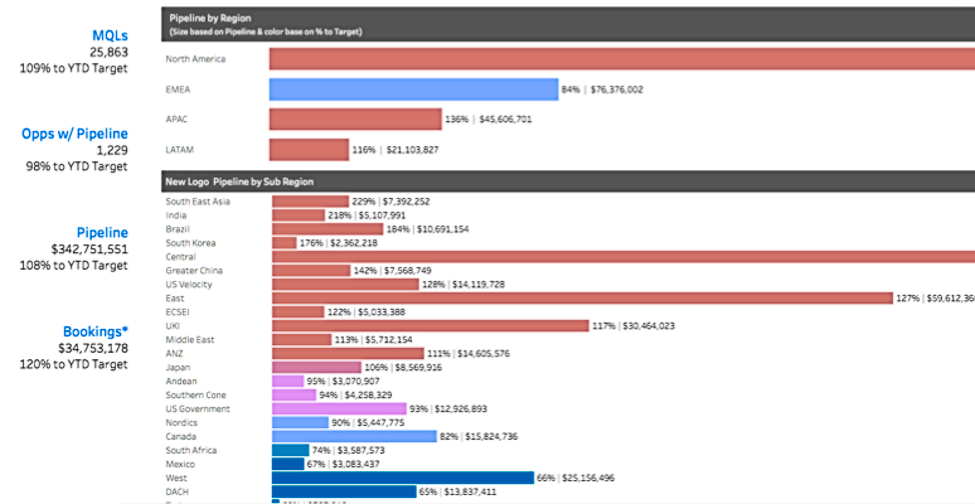
MQLs, Opportunities, Pipeline, and Bookings for Regions and Sub-regions
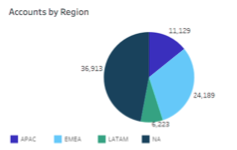
Global business regions are usually categorized as NA, EMEA, LATAM, APAC and ANZ. These geo clasifications can be further broken down into sub-regions depending on your strategic approach.
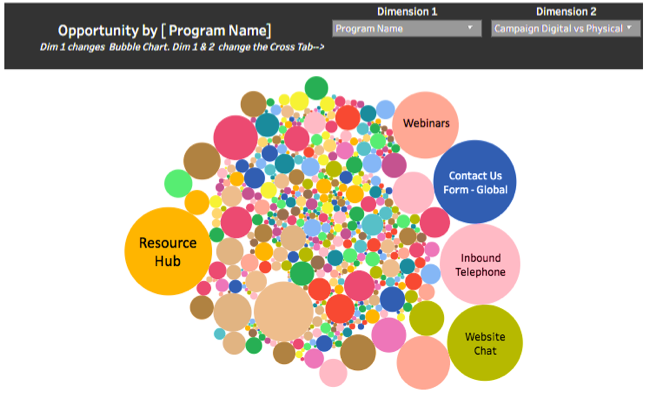
Understand both the volume and value from different sources
A bubble chart is a neat way to show Opportunity Numbers and Opportunity Values replaced with bubbles. The Number and value of Opportunities in the pipeline is represented in the size of the bubbles.
When it comes to revenue impact performance, sales and marketing alignment is key. The Command Center has to report on the impact that your marketing metrics have on sales pipeline and revenue. Report in the same Command Center to align both metrics. When marketing and sales departments work together, firms see 36% higher customer retention and 38% higher sales win rates from those teams. (Hubspot, 2017) Let your company numbers speak for themselves.
Monitor Pipeline generated by Sales, Partners and Marketing sourced opportunities
You have to give credit to different sources of Opportunities. Some Opportunities might be sourced by Marketing or by Sales teams themselves or you might use a network of Partners to source Opportunities. To learn more about Partner Marketing, read about the 5 Key Partner Marketing Strategies we recommend.

Compare Your Channels and their MQLs, SQLs, and Won Opportunity Value

To better understand your sales metrics, the amount sourced in your marketing activity pipeline can be attributed to opportunities and then organized by revenue generated. These can be further split into:
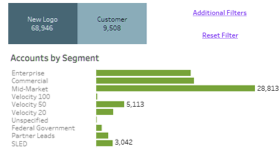
Your Account Hub looks at your whole universe of accounts. This allows you to prioritize your top target accounts and further segment your account tiers.
How do you go about creating your ideal Target Account List? Use these common strategies to identiy your Target Accounts profiles based on your Buying Personas and already Won Opportunities.
 Total addressable market (TAM), refers to analyze the overall revenue opportunity available for your services. TAM helps you to prioritize strategies and serves as a useful, identifiable metric to quantify potential.
If you don’t have data on all your accounts in your target universe, then look into data vendors to complete the missing information. You should complete both missing contacts at your Target Accounts and also bring in all missing Accounts from your TAM. Use the following data vendors to help you:
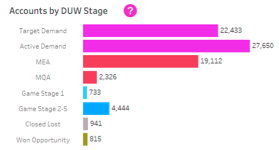
The Account Hub of your Command Center allows you to keep an eye on your Segments, Regions, and Expansions into Existing Customers. If you are using the Demand Unit Waterfall then you should monitor two new stages:

Our advisers help make your job easier on an ongoing basis. Adapting to your work style, we are a natural extension of your team for ongoing projects and campaigns. Use dedicated support for your marketing operations needs, so you’ll be able to focus on the larger marketing picture. Leave the details to us. Start your support now.
With this option, the length, scope and team for the assignment is as you request it. Use our resources to help speed up different projects and initiatives. Our highly skilled advisers come together to help you deliver your marketing objectives on time. See if a project-based support is a fit for you.
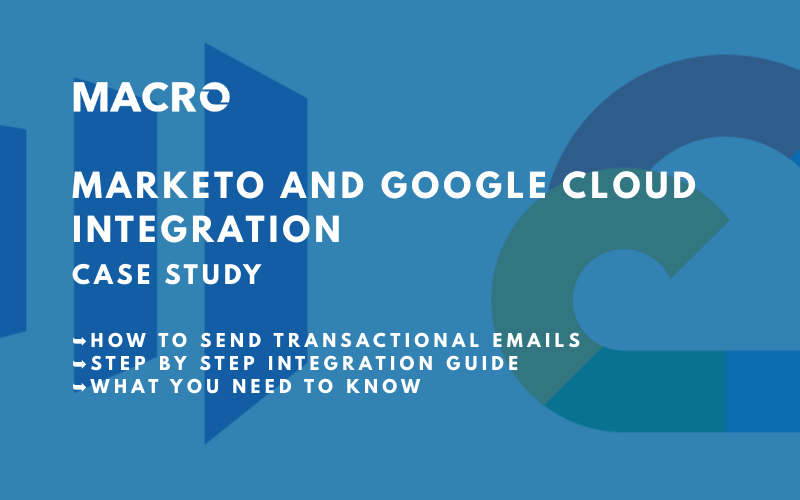
One of our clients here at Macro is a major utility company in the United States. This is their story, challenges and the middleware solution Macro provided for them bringing together different data-points to send order confirmation emails.
Read More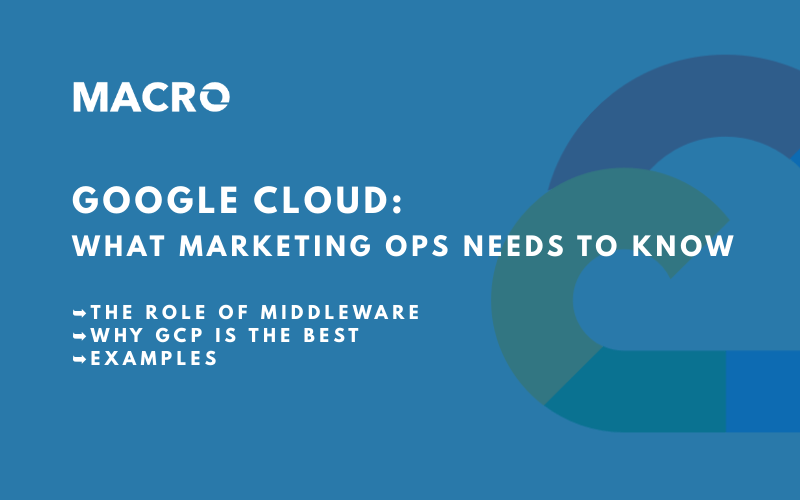
Today, more than ever, companies need to use many digital marketing tools, and a key piece of the puzzle is getting different tech platforms to ‘talk’ to one another. We can achieve this with middleware. Google Cloud Platform is a newer player to the middleware game, but it is easily one of the most affordable, balanced and powerful tools available in 2020.
Read More
It would be a shame to spend a small fortune on an expensive car, only for it to sit in your garage, rarely used. This depressing story is something that happens to many modern organizations—except it’s not an expensive vehicle that they leave rusting in a garage, it’s their enterprise marketing automation platform (MAP)
Read MoreMacro makes it easy for companies to run marketing and sales operations at scale. We enable companies with their digital marketing technologies to make better data-driven decisions.
Macromator Inc.
417 Bloor St West, Unit 203 Toronto, Ontario M5S 1X0
Satellite offices in San Diego, São Paulo, Bucharest, Spain, and China

+1 647 760 8629
info@macromator.com
© Macromator Inc. All rights reserved. | Privacy Policy